Linux Server Monitoring & Uptime Guide: Tools and Best Practices
Master Linux server monitoring with proven tools and techniques. Improve uptime, boost performance, and ensure reliable infrastructure.

If you’re running a VPS for the first or the tenth time, setting up server monitoring might feel like overkill. After all, your site is online, the app responds, and nothing seems broken. But the truth is, monitoring plays a huge role in keeping your servers reliable.
Even if you’re managing just a handful of servers, server uptime monitoring ensures you’re not left guessing. Without it, you may not realize your CPU is maxed out until pages slow to a crawl, or that your disk space has filled up until your website suddenly goes offline.
In this guide, we’ll cover:
- What Linux server monitoring actually means and why it matters.
- The essential metrics (CPU, memory, disk, network, uptime) you should track.
- The most popular monitoring tools and how they fit small-scale setups.
- Best practices to keep monitoring useful without overwhelming yourself.
By the end, you’ll understand how to set up a monitoring foundation that grows with your needs.
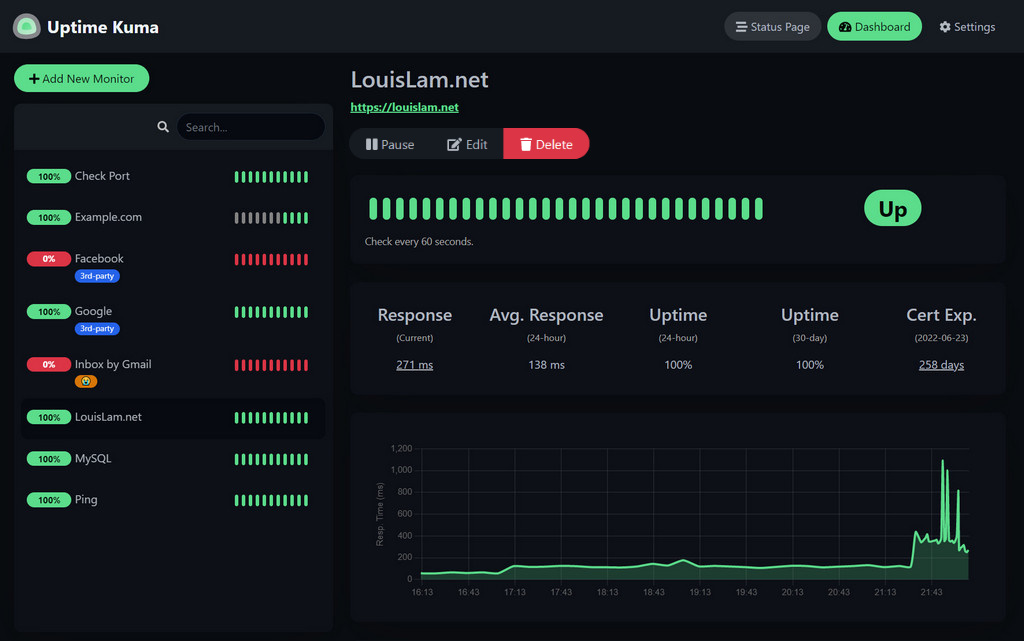 Uptime Kuma overview
What is Server Monitoring?
Core Concepts
At its core, Linux server monitoring is the practice of observing and analyzing a server’s performance, availability, and resource usage over time. The goal is to ensure servers stay as operational, efficient, and responsive as possible.
To do this, monitoring tracks key server resources like CPU, memory, disk, network, and uptime. That way, you’ll know not just when performance issues occur, but also the exact moment your server goes offline.
Two main approaches define monitoring:
- Reactive Monitoring: responding to issues after they occur. For example, getting an alert after a server goes down.
- Proactive Monitoring: spotting warning signs before they cause downtime, like noticing a memory leak before it consumes all available RAM.
Running Docker Containers? Learn How to Monitor Docker Containers with Real-time Alerts
Why Monitoring Is Critical
Applications are only as reliable as the servers they run on. If your server fails, so does your app. And in today’s world, user expectations for uptime are unforgiving.
Even short outages can:
- Disrupt online transactions.
- Cause user frustration and churn.
- Trigger SLA (Service-Level Agreement) penalties.
- Undermine confidence in your brand.
And those aren’t just technical headaches—they directly impact revenue.
Real-World Impact of Poor Monitoring
Outages almost always translate to real financial costs for businesses running e-commerce sites, SaaS platforms, or digital services.
Consider this: Amazon once estimated it loses over $220,000 per minute of downtime. While your business may not operate at Amazon’s scale, downtime has a proportional impact.
Examples of poor monitoring outcomes:
- Small business e-commerce site: Goes offline for two hours during a holiday sale. Lost revenue plus negative customer impressions.
- SaaS platform: A memory leak goes unnoticed. The platform crashes during peak usage, support tickets spike, and reputation suffers.
- Content website: Log files silently consume all disk space. Once full, the server refuses new requests until emergency cleanup.
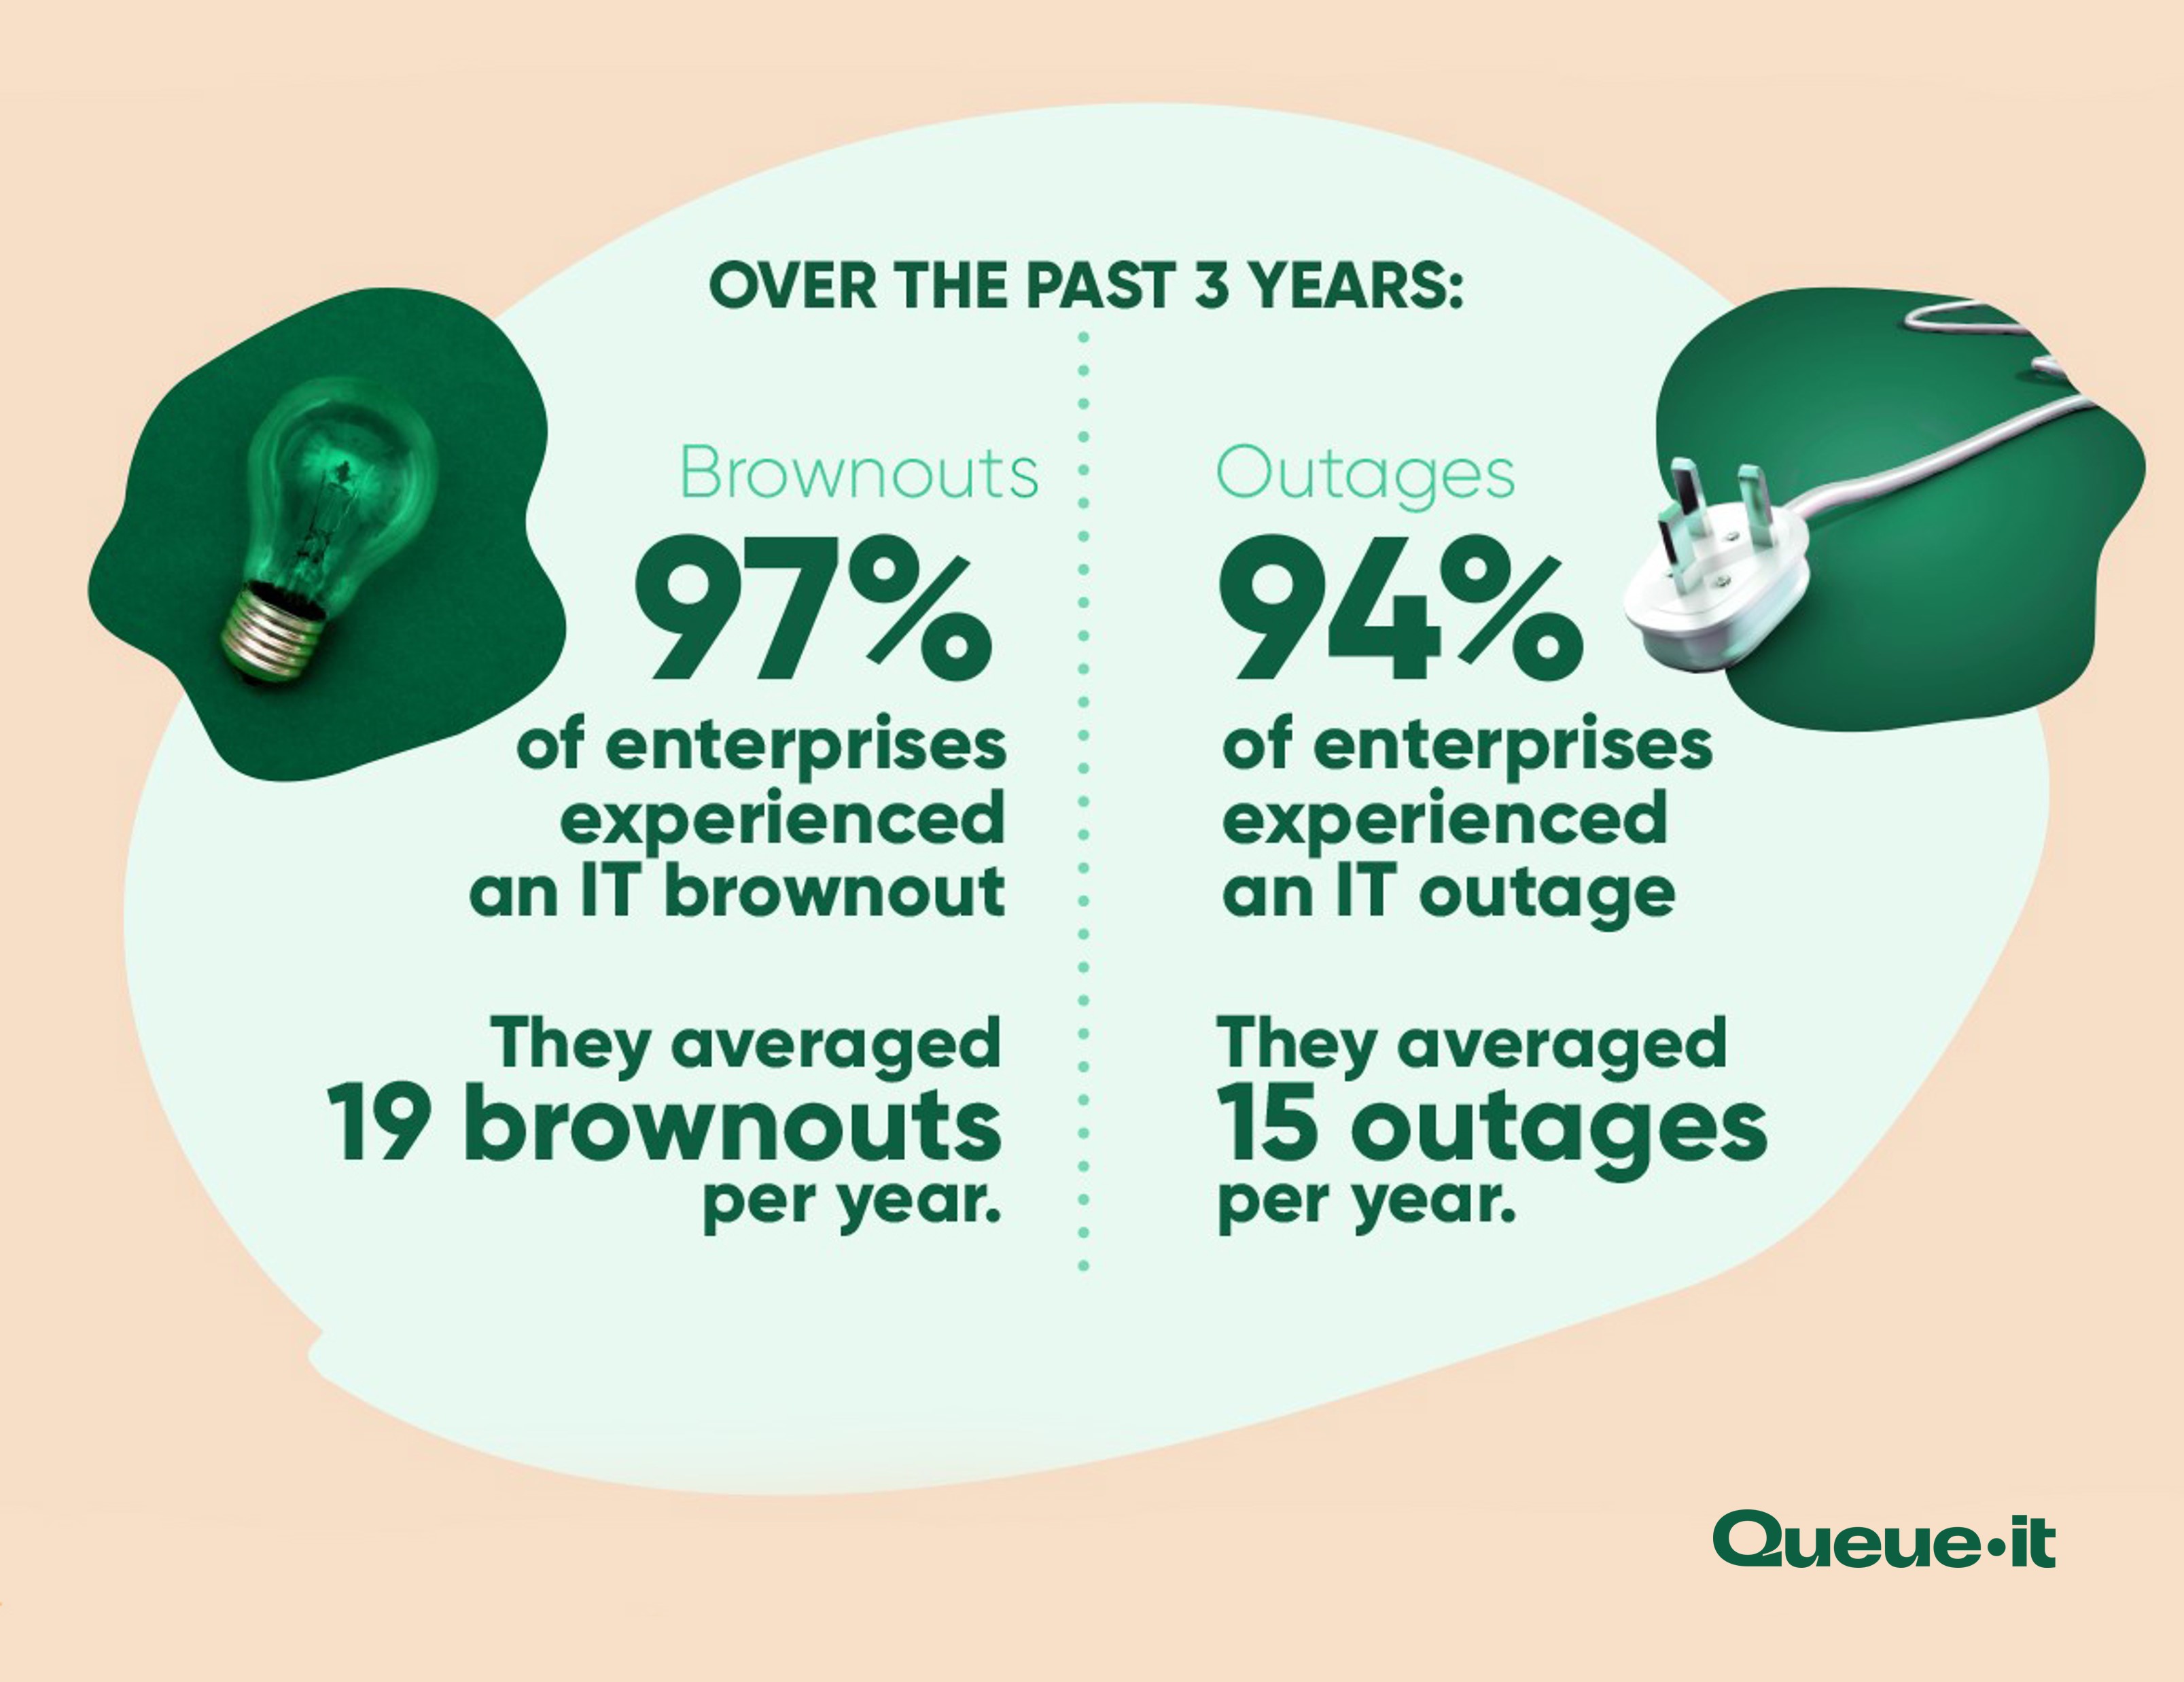 Source The cost of unexpected downtime
Essential Metrics to Understand
CPU Usage
CPU usage shows how much processing power is being consumed at any given time.
- Normal usage: 10–40% under typical workloads.
- Warning signs: sustained 80–100% usage often indicates a bottleneck.
- Common causes: runaway processes, inefficient code, excessive database queries, or underpowered hardware.
Useful commands:
toporhtop— real-time view of processes and CPU usage.btop— a modern, more visual alternative tohtop.mpstat— show CPU usage per core.
Debugging tips:
- Identify heavy processes with
htoporbtop. - Optimize resource-hungry applications.
- Consider scaling horizontally (more servers) if CPU saturation is constant.
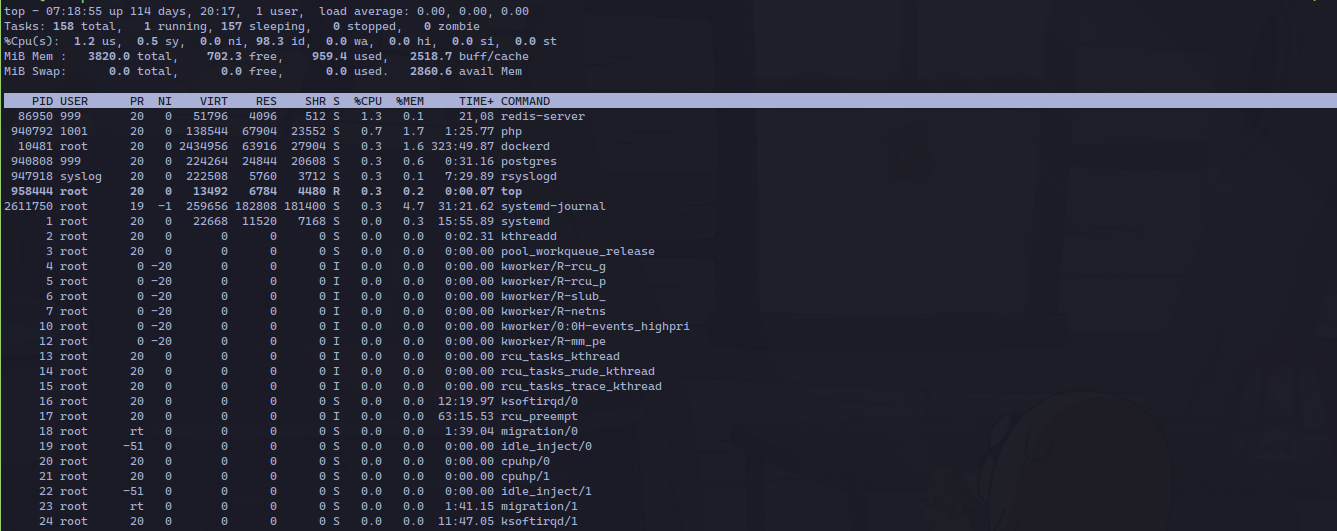 A server running the
 top command
Memory
RAM is one of the most critical resources for performance.
- Healthy memory usage: fluctuates based on active processes.
- Problems: memory leaks cause usage to climb steadily without dropping. Swap usage (disk-based memory) is another red flag—it slows performance drastically.
Useful commands:
free -h— quick snapshot of memory and swap usage.vmstat 5— show memory, processes, and CPU every 5 seconds.btoporhtop— real-time memory monitoring.
When scaling becomes necessary:
If memory usage consistently hovers near 90–95%, it’s time to add more RAM or optimize applications.
Disk Space
Running out of disk space can grind a server to a halt.
- Log growth: web and application logs can expand quickly, especially with verbose error logging.
- Database expansion: without pruning old records or archiving, databases can consume huge amounts of space.
- Inodes: servers can also “run out of files” even if disk space remains, especially when storing many small files.
Useful commands:
df -h— shows disk usage per partition.du -sh /var/log/*— check which log files are growing large.ls -i— check inode usage if disk space looks fine but writes are failing.
Best practices:
- Set alerts when usage reaches 70–80%.
- Implement log rotation (
logrotateon Linux). - Schedule database maintenance and archiving.
Network
Your server’s ability to send and receive data depends on stable networking.
- Latency: higher-than-normal response times may indicate congestion or routing issues.
- Bandwidth consumption: sudden spikes can mean legitimate traffic surges—or DDoS attacks.
- Packet loss: small amounts are normal; sustained losses suggest hardware or ISP problems.
Useful commands:
ping <host>— test connectivity and latency.traceroute <host>— trace the path packets take.iftop— see live bandwidth usage by connection.ss -tulwn— list open ports and listening services.
Debugging tips:
- Tools like
ping,traceroute, andiftophelp trace network performance. - Correlate spikes with application activity (e.g., a marketing campaign driving traffic).
Note: Some of these tools (like htop, btop, and iftop) may need to be installed first using your package manager (e.g., apt, yum, or dnf).
Why Server Uptime Monitoring Matters
Uptime measures how long your server and its applications have been running without interruption. Unlike CPU or memory, it’s less about performance and more about availability. The higher your uptime, the more trust users place in your service and the more likely you are to meet client commitments.
Even small amounts of downtime can add up quickly:
- 99.9% uptime (three nines) → about 8 hours of downtime per year.
- 99.99% uptime (four nines) → about 52 minutes of downtime per year.
Useful commands:
uptime— shows how long the system has been running and the average load.systemctl status— check if critical services (like web servers or databases) are running.
 Uptime monitors from Uptime Kuma
But basic commands only show the present moment. To really stay ahead, server uptime monitoring tools track availability continuously and alert you the instant downtime happens, ideally before your users even notice.
How Each Metric Helps Debug Problems
Each metric tells a piece of the story:
- High CPU + high memory = application inefficiency.
- Low memory + normal CPU = memory leak.
- Disk full but CPU idle = log buildup.
- High latency + high CPU = server under load.
- High latency + normal CPU = network issue.
The art of monitoring lies in correlating metrics to pinpoint root causes.
Popular Monitoring Solutions for Linux Server Monitoring
There are dozens of tools available, but three stand out as industry staples.
Nagios
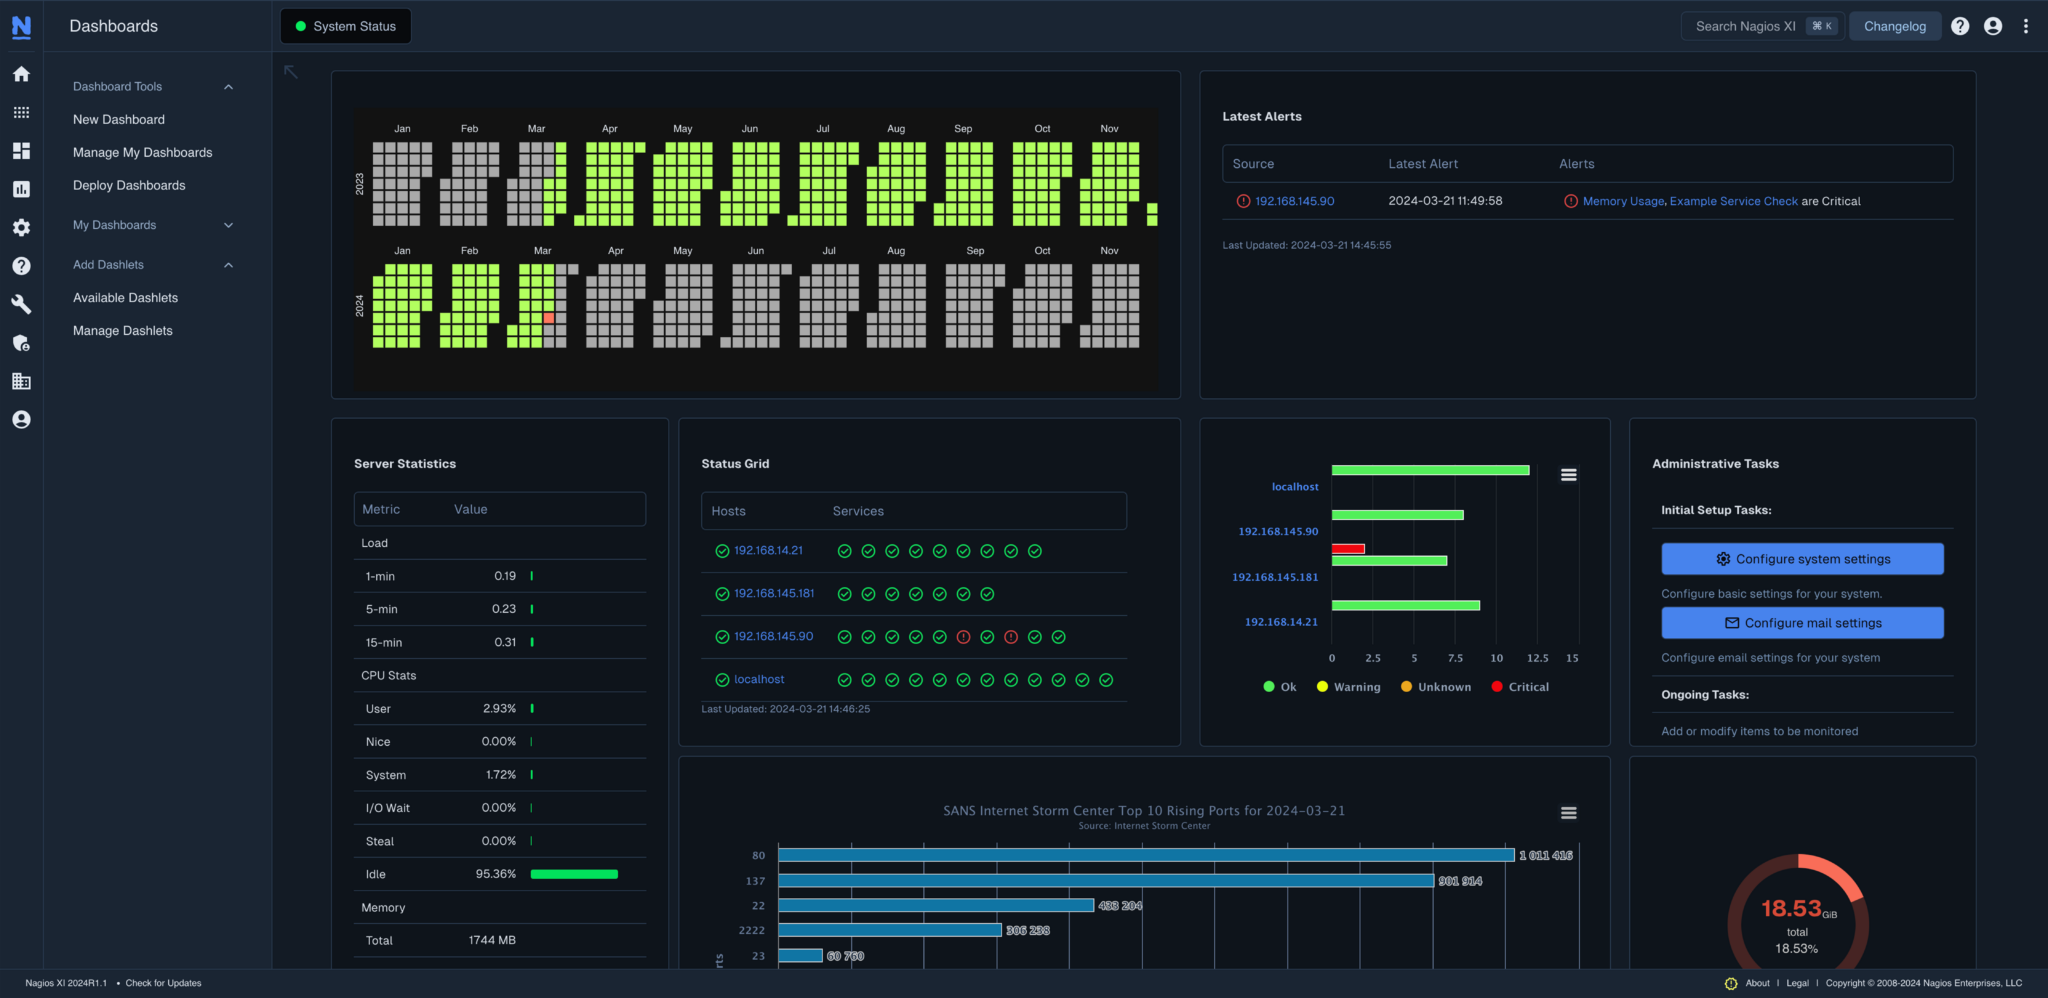 Nagios Dashboard showing server performance
Pros:
- Enterprise-grade, battle-tested.
- Extreme flexibility and can monitor anything via plugins.
- Large community and strong documentation.
Cons:
- Complex setup and steep learning curve.
- Time-intensive to configure and maintain.
- Dashboards feel dated compared to modern alternatives.
Nagios has long been used in Linux server monitoring setups. It’s great for large organizations with dedicated sysadmins, but overkill for smaller teams.
Zabbix
Pros:
- Comprehensive dashboards with auto-discovery of hosts.
- Scales well for medium-to-large environments.
- Strong alerting system with fine-grained rules.
Cons:
- Can be resource-heavy.
- Overwhelming for beginners; too many knobs and dials.
Zabbix is often chosen for both performance tracking and server uptime monitoring in small to mid-sized environments.
Prometheus + Grafana
 A Grafana Dashboard showing Website Performance
Pros:
- Modern, cloud-native approach.
- Excellent at time-series data (e.g., metrics over time).
- Grafana offers best-in-class visualization.
- Huge ecosystem of exporters and integrations.
Cons:
- Steeper learning curve for newcomers.
- Requires more initial setup than turnkey tools.
Prometheus + Grafana are the go-to choice for modern DevOps teams. They provide rich visualization for both Linux server monitoring and uptime tracking alike.
Best Practices for Effective Linux Server Monitoring
Set Realistic Alert Thresholds
If thresholds are too strict, you’ll drown in alerts. Too loose, and you’ll miss critical issues. Use historical data to set thresholds that make sense for your workload.
Avoid Alert Fatigue
Too many false alarms lead teams to ignore notifications. Focus alerts on actionable issues: CPU stuck at 95% for 10 minutes is worth an alert; a single spike is not.
Documentation and Team Communication
Monitoring data is useless if it lives in a silo. Keep documentation updated and share dashboards across your team. Everyone should know how to interpret alerts and act quickly.
Regular Monitoring Health Checks
Ironically, monitoring systems themselves can fail. Schedule checks to ensure your tools are reporting correctly and alerting systems are firing as expected.
These practices apply whether you’re tracking system metrics or implementing basic server uptime monitoring alerts.
Conclusion
Both Linux server monitoring and server uptime monitoring form the backbone of reliable infrastructure. By tracking resource usage and availability, you prevent downtime, improve performance, and protect your users’ trust.
But while monitoring is essential, it can also be a headache. Configuring tools, setting thresholds, and managing dashboards takes valuable time away from what matters most; building and improving your applications.
That’s where we come in; let Serversinc handle the complexity of server monitoring and uptime tracking, so you can focus on development instead of babysitting servers. With built-in monitoring, alerts, and server management, Serversinc eliminates setup headaches so you can deliver reliable apps without the hassle.
Wrap-up
Deploying apps shouldn’t be complicated or expensive. Serversinc gives you the features of a managed hosting platform while keeping full control of your own servers.
If that’s the way you want to ship projects, create a free Serversinc account, try a 14-day free trial .