


Insights
Hardening, updates, resource pressure and outages, caught before they become incidents.
Insights are Serversinc’s way of telling you something needs attention: a server that stopped reporting, a disk that is filling, a hardening check that failed. Alerts decide what raises an insight, and notification channels decide who hears about it.
The operating loop has four parts:
- A server or application reports a signal.
- An alert decides whether that signal should raise an insight and carries its severity.
- Attached notification channels deliver the insight outside the dashboard.
- The insight resolves when its condition clears.
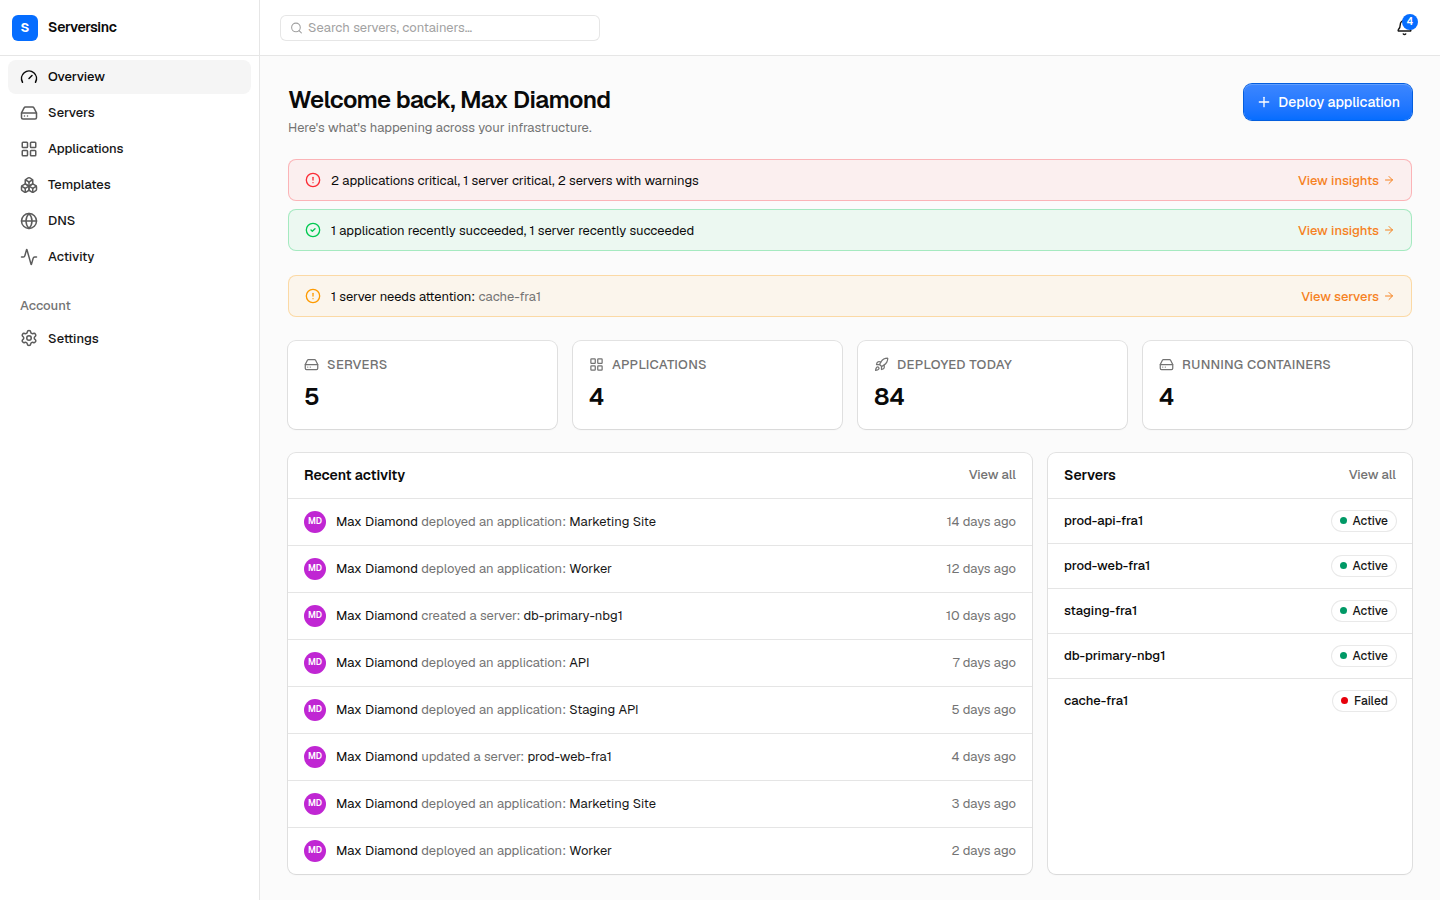
The overview groups insights by severity.
In this section
Section titled “In this section”- Server health and metrics: Host resources and hardening checks.
- Notifications: Email, Slack and webhooks.
Severity
Section titled “Severity”Each alert has a severity: Success, Warning, or Critical. The alert reference lists the severity of each built-in alert.
Route an alert to a channel
Section titled “Route an alert to a channel”- Open Settings → Channels and select the channel.
- In its Alerts list, add the alerts that should notify this channel.
- Save.
Removing an alert from a channel’s list stops that channel from receiving it. The alert still raises insights.
How an insight resolves
Section titled “How an insight resolves”An insight resolves automatically when the condition it watches clears. You can’t resolve it by hand.
Alert reference
Section titled “Alert reference”| Alert | Fires when | Severity |
|---|---|---|
| Server offline | A server misses its heartbeat | Critical |
| Container down | A container stops running unexpectedly | Critical |
| Disk usage | Disk use stays above 80% for 10 minutes | Warning |
| CPU usage | CPU use stays above 80% for 10 minutes | Warning |
| Memory usage | Memory use stays above 80% for 10 minutes | Warning |
| Server hardening | A hardening check (SSH root login, Fail2Ban, and similar) fails | Warning |
| OS updates | Pending operating system updates are found | Warning |
| Backup failed | A backup does not complete | Warning |
| Deployment event | A deployment happens | Warning |
| Container event | A container lifecycle event happens (start, stop, restart) | Success |
A server misses its heartbeat when no report arrives for 12 minutes. The agent reports every 5 minutes and runs hardening checks daily. See The agent.
The built-in alerts have fixed thresholds and severities.
Custom alerts and mutes
Section titled “Custom alerts and mutes”The REST API and MCP server can do more than the dashboard:
- Custom alerts.
POST /v1/evaluators(orcreate-evaluator-tool) creates an alert with your own metric (cpu,memory,disk,network), comparator, threshold, sustained window in minutes, severity, and scope (organisation or one server). An organisation can have up to 100 custom alerts. - Mutes.
POST /v1/insight-mutesstops one alert from raising insights for one resource, such as a build server that runs hot by design. A mute is permanent until you delete it.